
Outlier detection and removal using Zscore in Python:
This method is used for normal distribution or close to normal distribution.
Importing Libraries:
Loading dataset:

Printing first 10 rows:

Statistically describing the dataset:

Visualizing outliers by boxplot:

Visualizing outliers by seaborn boxplot:

Visualizing outliers by hist plot:

Histogram with density plot:

Mean and Standard deviation of the age column:

Setting upper and lower limit as 1 std:
You can set 1,2 or 3 standard deviation as upper limit and lower limit.


Data within the lower and upper limit( Without outliers):

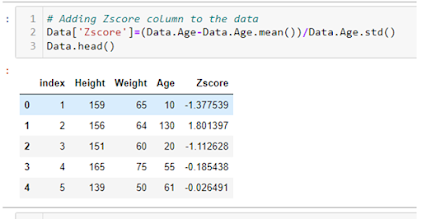
Adding Zscore column to the data:
Rows with Zscore greater than 1 and lesser than 1(outliers):


0 Comments