Outlier detection and removal using Percentile in Python:
December 09, 2022
Outlier detection and removal using Percentile in Python:
Importing Libraies:
Printing first 10 rows:
Statistically describing the dataset:
Visualizing outliers by boxplot:
Visualizing outliers by seaborn boxplot:
Visualizing outliers by scatter plot:
Visualizing outliers by hist plot:
Setting Maximum Threshold:
Data above Maximum Threshold:
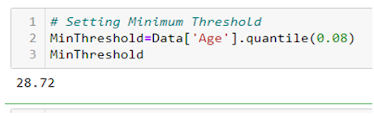
Setting Minimum Threshold:
Data below Minimum Threshold:
Data within the Maximum and Minimum Threshold:


0 Comments