
Data visualizations in Python for data science:
1)Line plot:Importing the libraries and loading the datset:
 |
| Importing libraries and loading the dataset |
Printing first five rows:

Printing first five rows
Line plot between timeplot and signal:

Lineplot in seaborn
Line plot with hue parameter:
|
| Lineplot in seaborn |
Hue parameter takes column name for colour encoding.
 |
| Line plot with hue parameter |

Lineplot with hue, style and markers
2) Barplot:
Loading the diabetes dataset and printing the first five columns:

Loading the dataset
Plotting barplot between the columns outcome and insulin:

Barplot in seaborn
Plotting barplot and adding palette as bright:

Barplot with palette
3) Scatter plot:
Loading iris dataset:

Loading the dataset
Scatter plot between columns sepal_width and petal_width with hue as species:

Scatterplot in seaborn
4) Histplot/distplot:
Loading "taxis" dataset:

Loading dataset
Printing histogram and frequency curve on column fare:
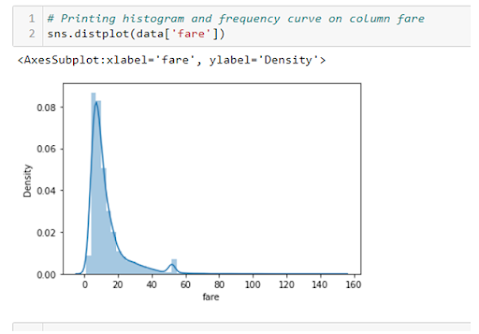
Histogram and frequency curve
Printing only frequency curve on column fare by making hist false:

Printing only frequency curve
Printing histogram frequency curve on column fare and adding color:

Histogram and frequency curve by adding color
Printing only histogram on column fare and adding color:

Only histogram with colors
Printing only histogram on column fare and adding color and bin size:

Histogram with bins
Printing vertical histogram on column fare and adding color and number of bins :

Vertical histogram
5) Boxplot:
Loading "tips" dataset and printing first five columns:
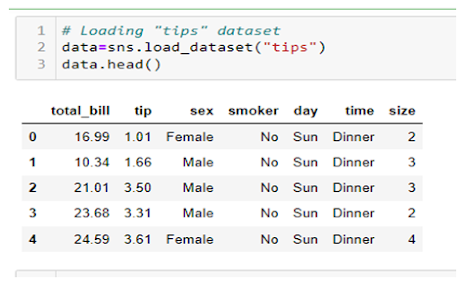
Loading tips dataset
Printing boxplot on columns sex and total_bill:
|
| Loading tips dataset |

Boxplot in seaborn
Printing boxplot and adding hue and palette:

Boxplot with hue and palette


0 Comments